From data to form
Method.
The material is history.
The medium is code.
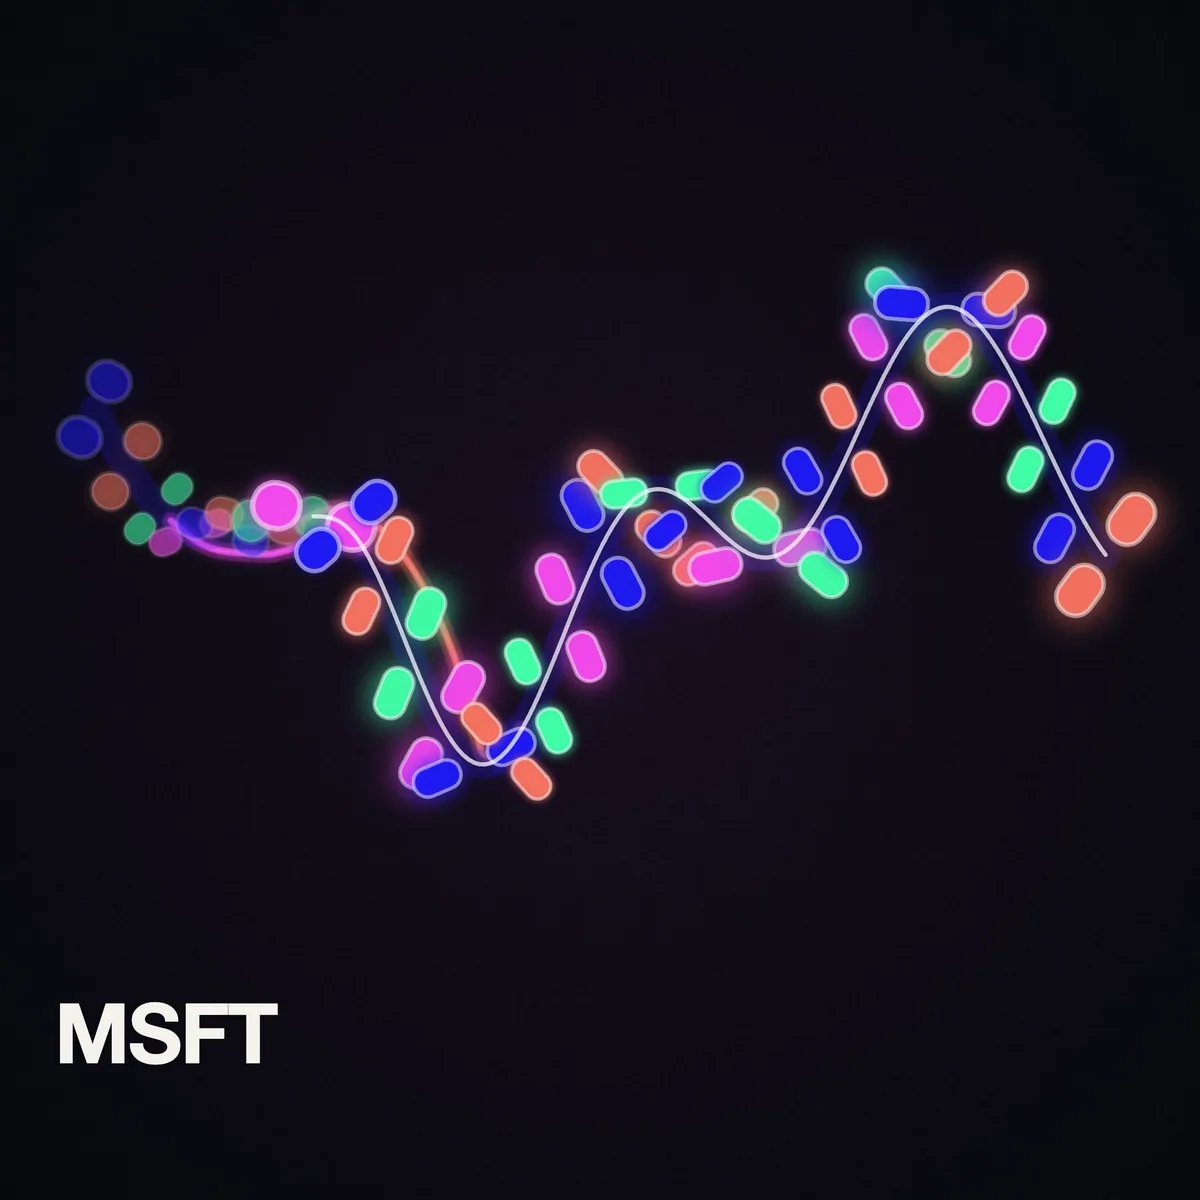
Reading a work / MSFT
A company’s record,
not its price chart.
Each Tickerz begins with a structured record: a company, its founding and listing dates, its sector and selected events from its history.
Those inputs meet a shared set of drawing rules. The rules are an artistic interpretation of the record, not a plot of daily share prices.
- Company
- Microsoft
- Founded
- 1975
- First public listing
- 1986
- Structure / pulse
- Branched / Slow
The visual language
What the record
changes.
All 666 works use the same vocabulary. Their differences come from the company record and the parameters assigned to it.
01Dates → position
The founding year and the end of the recorded history define a timeline. Events are positioned along it in proportion to when they occurred. That timeline runs through the composition as its spine.
02Listing → a threshold
The first public listing marks a change along the spine. Before that point, the marks are quieter and smaller; beyond it, they carry more light. The years before the market are still part of the work.
03Events → interruptions
Selected historical events are encoded in the record. Those marked as ruptures interrupt the trace; the structure rules place branches around event positions. Not every event becomes a break.
04Market lives → echoes
An uninterrupted market life and a return after an interruption leave different traces. Multiple lives can add an echo alongside the principal line. A terminal trajectory has its own ending.
05Sector → colour
Sector sets the starting palette. Spectrum and a fixed seed introduce variations in hue, saturation and light. The colours belong to the generative system, not to company logos.
06Tenure → density
Market tenure helps determine the number of marks. Events and structural complexity adjust that density. Separate pulse and rhythm parameters control how the composition moves.
A fixed identity, in motion
The work moves.
Its record stays.
Each company has a fixed seed and set of parameters. Given the same program, record and moment in time, the system reconstructs the same composition. Refreshing the page does not create a new edition.
The movement is drawn in your browser from the original program. It is not a video playback or a live market feed. A company’s record does not change when its share price moves.
History provides the material; the artist defines how it is translated. The Tickerz is an artwork, not a financial chart or an ownership claim on the company.
Keep looking